Step 01: introduction to HST models
As a non-professional trader, I have been following for many years a simple “Buy & Hold” strategy on stocks or indexes, trusting that stock markets (especially the tech / advanced stocks in the US) could give me the best performance in capital growth, in the long term.
But Buy & Hold strategy works fine only if you can wait for months or even years, when you go through main bear markets like 2001-2002 or 2008-2009.
I’ve been there (yeah, I am that old..) and during those times I have suffered bad losses, bringing me to close my positions (usually near the lows) and then it was impossible for me to re-enter at the right time to take advantages of the following recoveries or bull markets.
Also, bank charges eroded my capital for a guidance that had practically zero-value for me, as it wasn’t able to avoid any of those crashes.
So I have been trying to come up with my own strategies, having these main features:
Taking advantages of the main positive bias (long term growth) of US stock market, stepping aside during main corrections or bear markets, to reduce drawdowns and avoid the unfavorable times;
If I could reduce the drawdowns thanks to these models, I could apply some leverage, using the the recent availability of ETFs, magnifying returns and keeping drowdowns to acceptable levels
Since I cannot sit in front of a PC the whole day, I was looking for consistent signals to tell me about when to enter and when to exit from the market, in terms of days, weeks or months (no scalping)
2019: Baby steps towards quantitative models
how to step aside when things go wrong...
Since 2019, backtesting many variables' behavior (not only stock prices or indexes, but also volatility, Dark Pools indicators, technical and fundamental data), I found some really interesting models, which could magnify my returns.
For example, in the 75 years 1951-2025 the S&P500 gave an average CAGR of ~8% and it suffered drawdowns of magniutude -30%, -40% or even -56% in 2009.
>> So, let's keep in mind these two figures: CAGR=8% MDD=56%
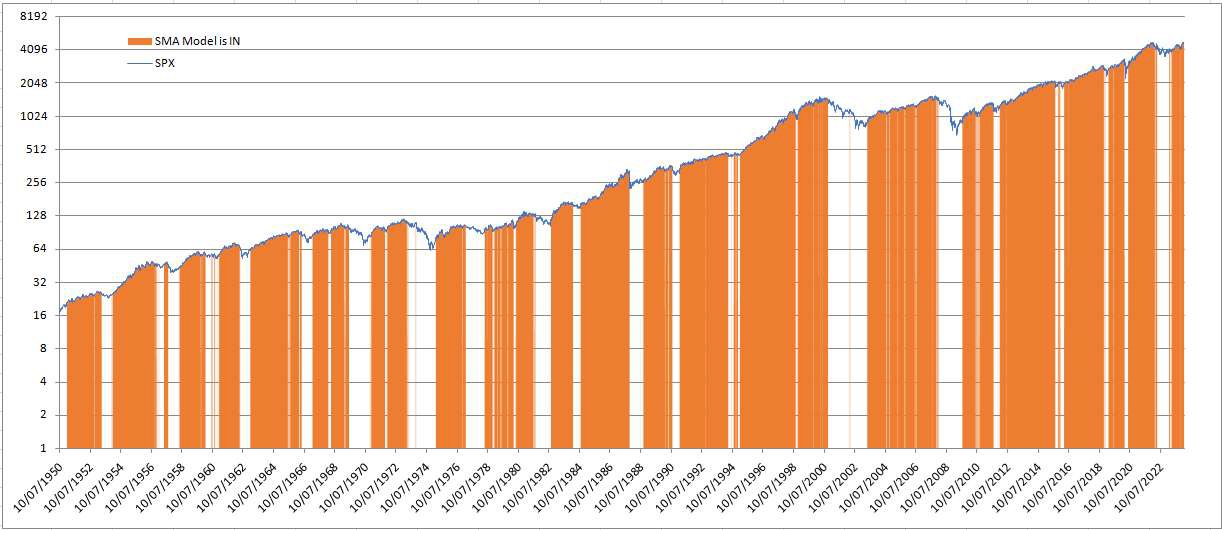
A very primitive strategy - one of the earliest I have backtested - is the 262 sma on S&P, which follows this simple rule:
Buy SPY (ETF copying 1x S&P500) when the S&P500 > the simple moving average on 262 days
Else: go CASH
This simple strategy (assuming that SPY was available in 1951, which it wasn't) would avoid main bear markets and corrections and it would have given approx the same CAGR (~8%) but with much smaller drawdowns (-18.9%).
Such small dd open to me the possibility of using leverage.
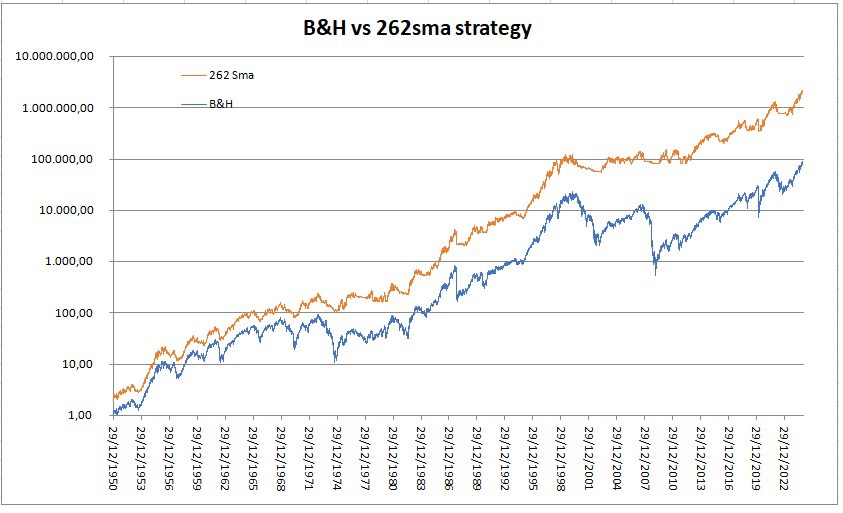
A levered strategy using same input (the only closing prices of S&P500) would act like this:
Buy UPRO (ETF copying 3x S&P500) when the S&P500 > the 262 sma
Else: go CASH
and it would have magnified returns, with drawdowns similar to the simple B&H strategy.
>> CAGR=22% MDD=48%
The difference is well shown in this chart:
With this amazing improvement in mind, I have backtested hundreds “basic” models and then tried several combinations among them, in order to have the most interesting CAGR / MDD ratio to achieve my financial goals.
And I came up with some amazing trading models. Go to next step: