V model: how it works
The V model is based on Technical Analysis (TA) of Volatility indexes as VVIX and VIX
the proprietary algorithm works on daily level of V an VIX and computes an indicator, updated on daily basis. Its outputs are:
a binary indicator (can be positive or negative)
a "barometer" showing how fare we are from the inversion point
V barometer
based on VVIX / VIX ratio
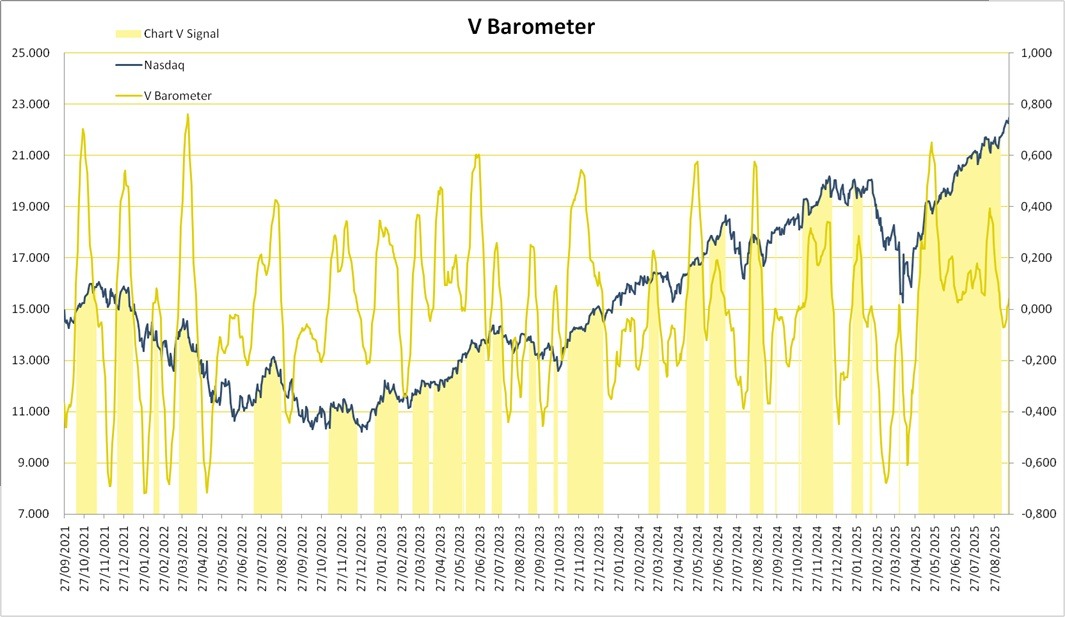
Using the V indicator as a trading strategy, backtested investment would use the following rules:
If V barometer is positive, then go Aggressive Long (= BUY $QQQ or $TQQQ)
Else, stay CASH
And would give the following performances (2011-2025):
V model - no leverage ($QQQ):
CAGR: 11.42%
Max drawdown (MDD): -14.8% (2025)
Note that the V model has similar returns, but much lower drawdowns, as the benchmark ($SPY), which during same period made:
CAGR: 13.09%
Max drawdown (MDD): -33.9% (2020)
V model - 3x leverage ($TQQQ):
CAGR: 32.72%
Max drawdown (MDD): -40.4% (2025)
The levered version can magnify returns, at the price of increased drawdowns